

I taught computing at an international school in Brunei.

When I joined the school, the student reports were Word documents on the school server. Only one teacher at a time could work on a student's report.

I volunteered to design a database with an interface, so that many teachers could work on the reports at once, and the data would be stored efficiently.
I made the first version of our school report database with Microsoft Access and Visual Basic.

The first set of reports were very simple - High School reports with just grades and a comment.

The teachers loved being able to enter their reports any time from any computer in the school. Over the next few years, teachers asked for more and more features, and more and more kinds of reports. Eventually all reports across the school (Early Years, Primary School and High School) were on the system.
Teachers wanted to see a photo of the student while writing the report, so I added that feature.

Teachers also wanted to be able to view all previous reports for a student as they wrote the new report, so I added an archive database which could be accessed right from the report writing interface.

Eventually the structure of the application consisted of 4 databases.

Teachers also wanted to be able to enter their reports from home, so I learned to make interactive web pages and made a whole new system using IIS and SQL Server.

When I left the school, there were many kinds of Primary reports


and many kinds of Secondary reports.


There was a comprehensive interface for teachers

with report entry forms for Primary teachers


and many report entry forms for Secondary teachers.


There was an interface for printing all the different kinds of reports.

I created a comprehensive management interface, so the person who took over from me could administer the reports easily.

There was a management interface for Primary reports


and a management interface for Secondary reports.


As we stored more and more previous reports in the archive, we started to use data science to query the data for meaningful insights.
Which students are attaining very high or very low results across all subjects?
I used a SQL query to find any students with either high mean and low standard deviation, or low mean and low standard deviation across their results. (After trying different values we chose for classification > 80 as "high mean", < 60 as "low mean", and < 10 as "low standard deviation".)
    SELECT student_ID, AVG(grade) AS avg, STDDEV_POP(grade) AS stddev
    FROM student_grades WHERE date >= "2025-12-01" GROUP BY student_ID
    HAVING (avg < 60 OR avg > 80) AND stddev < 10;
Here's some example output - the query found one student with consistently low results (Cyrus Long) and one student with consistently high results (Mathew Baird).
| student_ID | name | avg | stddev |
|---|---|---|---|
| 1041 | Cyrus Long | 53.22222 | 7.86395 |
| 1062 | Mathew Baird | 88.34444 | 5.08114 |
Which students are suddenly performing higher or lower than usual in one or more subjects?
I used a SQL query to find any students who got a result in a subject which was well above or below their previous average in that subject. (After trying different values we chose for classification +/- 20 as "well above or below".)
    SELECT previous.student_ID, name, previous.subject, `previous avg`, grade
    FROM (
        SELECT student_ID, name, subject, AVG(grade) AS `previous avg`
        FROM student_grades WHERE date < "2025-12-01" GROUP BY student_ID, subject
    ) AS previous INNER JOIN (
        SELECT student_ID, subject, grade
        FROM student_grades WHERE date >= "2025-12-01"
    ) AS current ON previous.student_ID = current.student_ID AND previous.subject = current.subject
    WHERE grade >= `previous avg` + 20 OR grade <= `previous avg` - 20;
Here's some example output - the query found that Derek Brock's result was much lower than his previous average in arts and maths, and Latoya James's result was much higher than her previous average in drama.
| student_ID | name | subject | previous avg | grade |
|---|---|---|---|---|
| 1007 | Derek Brock | arts | 76.93333 | 43.2 |
| 1007 | Derek Brock | maths | 72.93333 | 44.8 |
| 1014 | Latoya James | drama | 67.03333 | 99.8 |
Which teachers are producing much higher or lower results than other teachers?
This was something the school leaders really wanted to know, and I wanted to help them find out. I decided to use a test called "ANOVA" or "Analysis of Variance", which has this formula.
I read some advice about using SQL for an ANOVA test, and the advice said it was far too complicated...challenge accepted!
I managed to work out a way to do an ANOVA test with SQL. This took some perseverance!
    SELECT
    MS_between.subject,
    `df between`,
    `df within`,
    `MS between`,
    `MS within`,
    `MS between` / `MS within` AS F,
    ELT(`df between`, 3.84, 3.00, 2.60, 2.37) AS `F critical (5%)`,
    IF (`MS between` / `MS within` > ELT(`df between`, 3.84, 3.00, 2.60, 2.37), "significant difference", "") AS `significant?`
    FROM (
        SELECT
        subject,
        `df between`,
        SUM(classes.product) / `df between` AS `MS between`
        FROM (
            SELECT
            teacher_averages.subject,
            `number of students`,
            `teacher average`,
            `subject grand mean`,
            `number of students` * POWER(`teacher average` - `subject grand mean`, 2) AS `product`,
            `df between`
            FROM (
                SELECT
                subject,
                COUNT(grade) AS `number of students`,
                AVG(grade) AS `teacher average`
                FROM student_grades GROUP BY subject, teacher_ID
            ) AS teacher_averages INNER JOIN (
                SELECT
                subject,
                COUNT(DISTINCT teacher_ID) - 1 AS `df between`,
                AVG(grade) AS `subject grand mean`
                FROM student_grades GROUP BY subject
            ) AS subject_grand_means ON teacher_averages.subject = subject_grand_means.subject
        ) AS classes GROUP BY subject
    ) AS MS_between INNER JOIN (
        SELECT
        subject,
        COUNT(grade) - COUNT(DISTINCT teacher_ID) AS `df within`,
        SUM(square_difference.`square difference`) / (COUNT(grade) - COUNT(DISTINCT teacher_ID)) AS `MS within`
        FROM (
            SELECT
            grades.subject,
            grades.teacher_ID,
            POWER(grades.grade - means.mean, 2) AS `square difference`,
            grade
            FROM (
                SELECT
                subject,
                teacher_ID,
                grade
                FROM student_grades
            ) AS grades INNER JOIN (
                SELECT
                subject,
                teacher_ID,
                AVG(grade) AS mean
                FROM student_grades GROUP BY subject, teacher_ID
            ) AS means ON grades.subject = means.subject AND grades.teacher_ID = means.teacher_ID
        ) AS square_difference GROUP BY subject
    ) AS MS_within ON MS_between.subject = MS_within.subject;
Here's some example output - "df" is "degrees of freedom", "MS" is "mean square", and "F" is the measure of variance. If "F" is above "F critical" for that number of teachers, it means there is less than a 5% chance that the variance is random. The query found that in the subject "technology", the teachers' results were significantly different - the technology teachers' results could then be compared in detail. Note that the query also found that in the subject "arts" the F-statistic is high - the arts teachers' results could also be compared.
| subject | df between | df within | MS between | MS within | F | F critical (5%) | significant? |
|---|---|---|---|---|---|---|---|
| arts | 3 | 196 | 732.2434055 | 329.9322653 | 2.219374951 | 2.6 | |
| drama | 1 | 198 | 17.27430221 | 395.8263359 | 0.04364111388 | 3.84 | |
| English | 4 | 195 | 137.0942726 | 354.5139172 | 0.3867105518 | 2.37 | |
| geography | 2 | 197 | 109.2992075 | 345.8720491 | 0.3160105240 | 3 | |
| history | 2 | 197 | 138.500369 | 356.2403455 | 0.3887835017 | 3 | |
| maths | 4 | 195 | 405.1327648 | 351.1734549 | 1.153654295 | 2.37 | |
| music | 1 | 198 | 397.4045266 | 328.7606857 | 1.208795771 | 3.84 | |
| science | 4 | 195 | 563.5512687 | 346.1397556 | 1.6281032719 | 2.37 | |
| technology | 2 | 197 | 1305.902708 | 357.1618761 | 3.656332871 | 3 | significant difference |
I later tried the same ANOVA test using R, which only took a few lines, but produced exactly the same results.
    for(s in unique(student_grades$subject)) {
        print(s)
        student_grades %>%
        filter(subject == s) %>%
        aov(data = .,grade ~ teacher_ID) %>%
        summary() %>%
        print()
    }
Here is the output from R. Note that R has highlighted "arts" (less than 10% probability that the difference in grades is by chance) and "technology" (less than 5% probability that the difference in grades is by chance).
    [1] "arts"
                 Df Sum Sq Mean Sq F value Pr(>F)
    teacher_ID    3   2197   732.2   2.219 0.0872 .
    Residuals   196  64667   329.9
    ---
    Signif. codes:  0 ‘***’ 0.001 ‘**’ 0.01 ‘*’ 0.05 ‘.’ 0.1 ‘ ’ 1
    [1] "drama"
                 Df Sum Sq Mean Sq F value Pr(>F)
    teacher_ID    1     17    17.3   0.044  0.835
    Residuals   198  78374   395.8
    [1] "English"
                 Df Sum Sq Mean Sq F value Pr(>F)
    teacher_ID    4    548   137.1   0.387  0.818
    Residuals   195  69130   354.5
    [1] "geography"
                 Df Sum Sq Mean Sq F value Pr(>F)
    teacher_ID    2    219   109.3   0.316  0.729
    Residuals   197  68137   345.9
    [1] "history"
                 Df Sum Sq Mean Sq F value Pr(>F)
    teacher_ID    2    277   138.5   0.389  0.678
    Residuals   197  70179   356.2
    [1] "maths"
                 Df Sum Sq Mean Sq F value Pr(>F)
    teacher_ID    4   1621   405.1   1.154  0.333
    Residuals   195  68479   351.2
    [1] "music"
                 Df Sum Sq Mean Sq F value Pr(>F)
    teacher_ID    1    397   397.4   1.209  0.273
    Residuals   198  65095   328.8
    [1] "science"
                 Df Sum Sq Mean Sq F value Pr(>F)
    teacher_ID    4   2254   563.6   1.628  0.169
    Residuals   195  67497   346.1
    [1] "technology"
                 Df Sum Sq Mean Sq F value Pr(>F)
    teacher_ID    2   2612  1305.9   3.656 0.0276 *
    Residuals   197  70361   357.2
    ---
    Signif. codes:  0 ‘***’ 0.001 ‘**’ 0.01 ‘*’ 0.05 ‘.’ 0.1 ‘ ’ 1
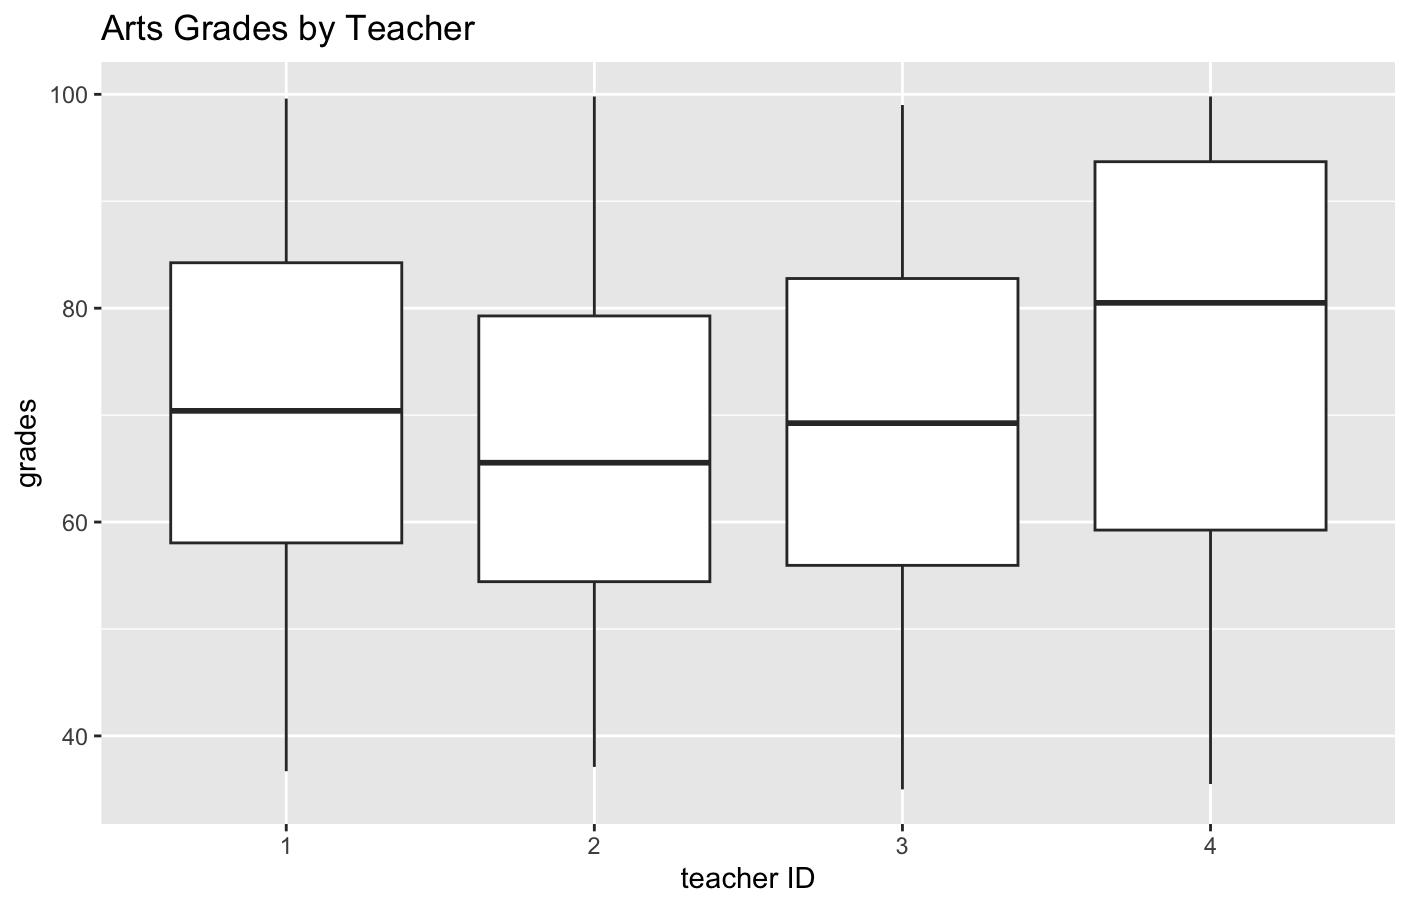
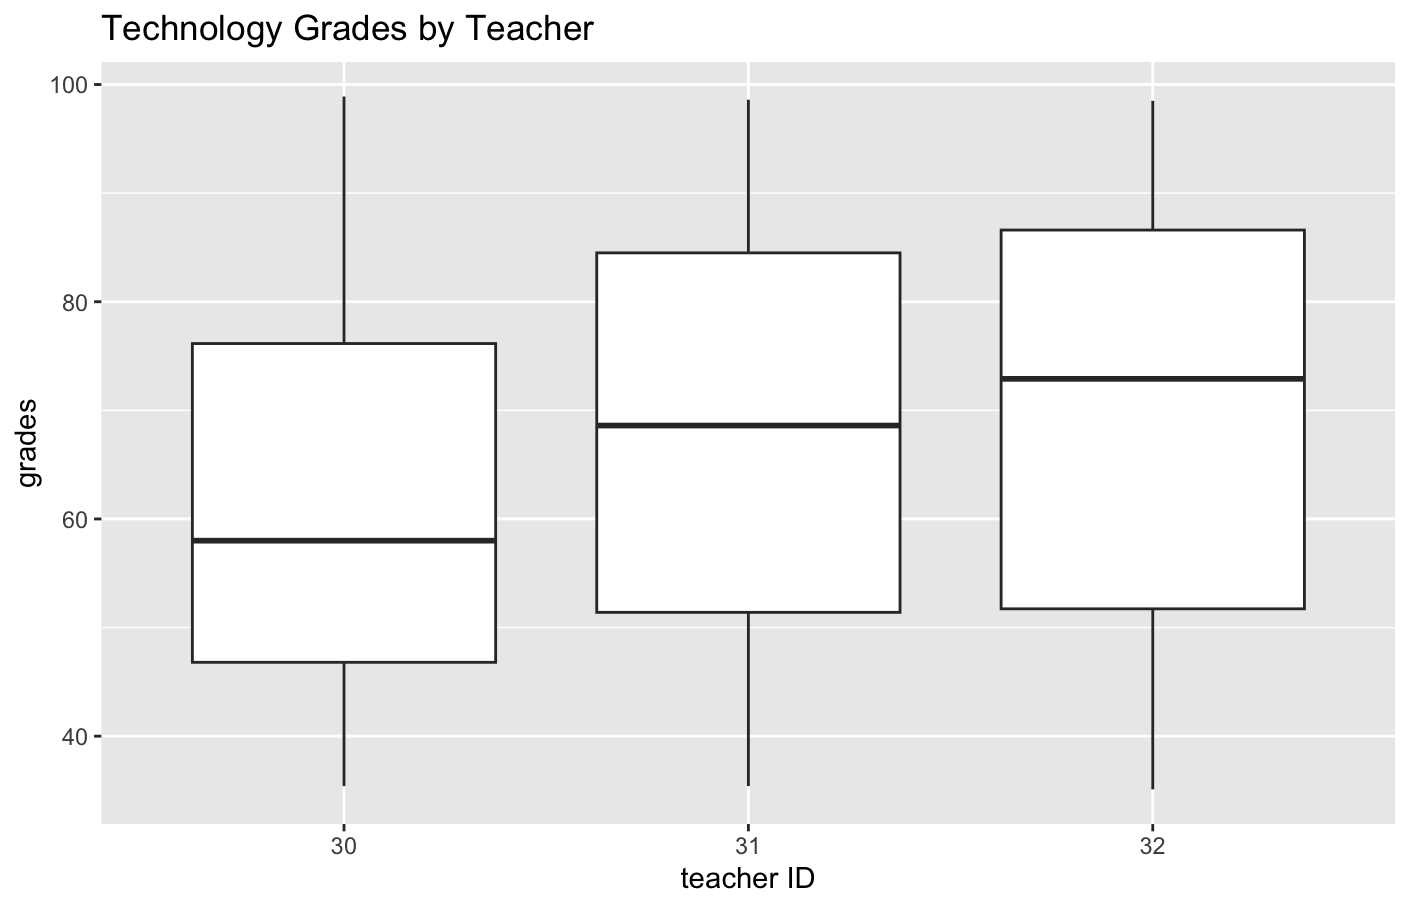
I used box plots to see which teachers gave different grades. The box plots quickly showed that in "arts" teacher 4's grades were a little bit higher, and in "technology" teacher 30's grades were significantly lower.
| arts | technology |
|---|---|
student_grades %>% filter(subject == "arts") %>% ggplot(aes(x = teacher_ID, y = grade)) + geom_boxplot() + labs(title = "Arts Grades by Teacher", x = "teacher ID", y = "grades") |
student_grades %>% filter(subject == "technology") %>% ggplot(aes(x = teacher_ID, y = grade)) + geom_boxplot() + labs(title = "Technology Grades by Teacher", x = "teacher ID", y = "grades") |
 |  |
I helped the school maintain the database for several years after I left, then eventually the school decided to migrate to a commercial solution.
I am very proud of the complete student report application we developed together!